One product surface for the evidence teams need every day.
CloudGrid starts with OpenTelemetry signals, then keeps dashboards, alerts, datasets, evaluations, and optimization results connected to the same project record. The result is easier to operate, easier to review, and easier to extend.
Distributed tracing
Start with the request path when a customer, workflow, or service behaves unexpectedly.
Explore
Log analytics
Search operational text without losing the trace and span context that explains where it happened.
Explore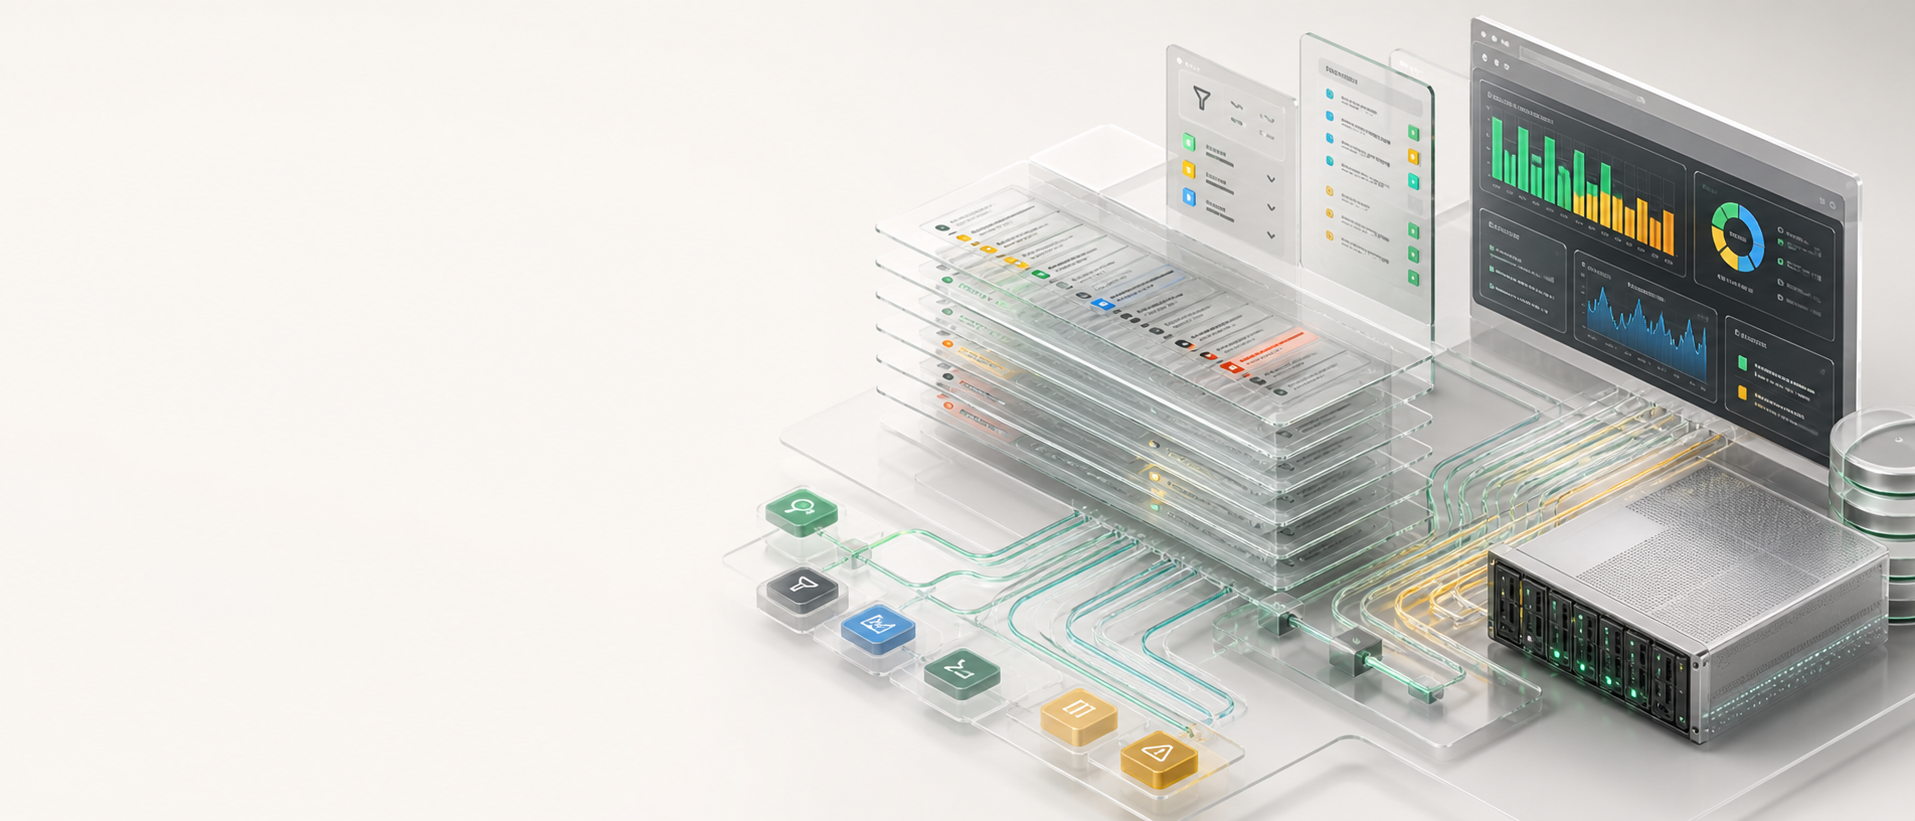
Metrics exploration
Read health, latency, volume, token, and cost signals as project data with linkable exemplars.
Explore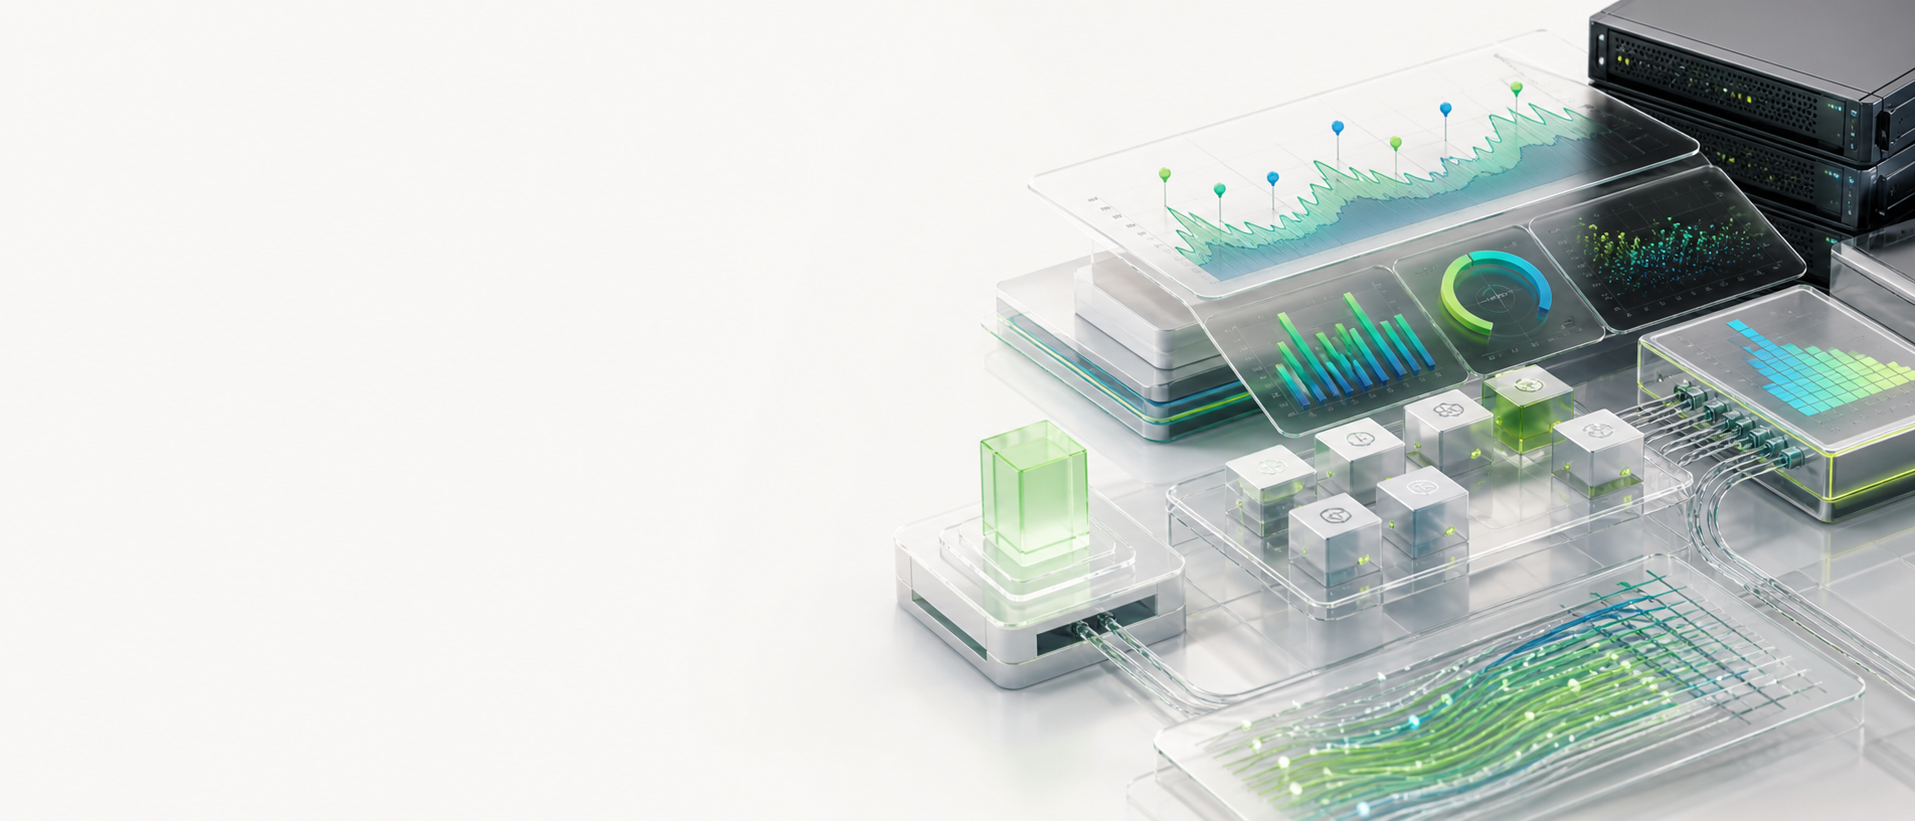
Dashboards
Turn repeated operational questions into saved project views for reviews and daily work.
Explore
Alerts
Let CloudGrid core evaluate rules and manage alert state while delivery can extend through adapters.
Explore
AI agent evaluation
Use production evidence to curate datasets, run evaluations, compare candidates, and optimize safely.
Explore
Customizable foundation
Adapt brand, packaging, auth, bridge, storage, delivery, and execution without changing the product idea.
Explore
The product shape behind the feature set.
The feature pages go deeper, but these principles are what make the system useful for enterprise operations rather than just another telemetry catalog.
Traces, logs, metrics, dashboards, alerts, datasets, evaluation runs, and optimization results belong to the same project, so ownership and access stay clear.
A trace can explain a log, a metric exemplar can point to a trace, and an AI evaluation row can keep its source evidence visible during review.
Ingestion, persistence, reads, live delivery, alert dispatch, and evaluation execution can be sized or extended around the customer workload.