Dashboards
Keep recurring operational questions one click away.
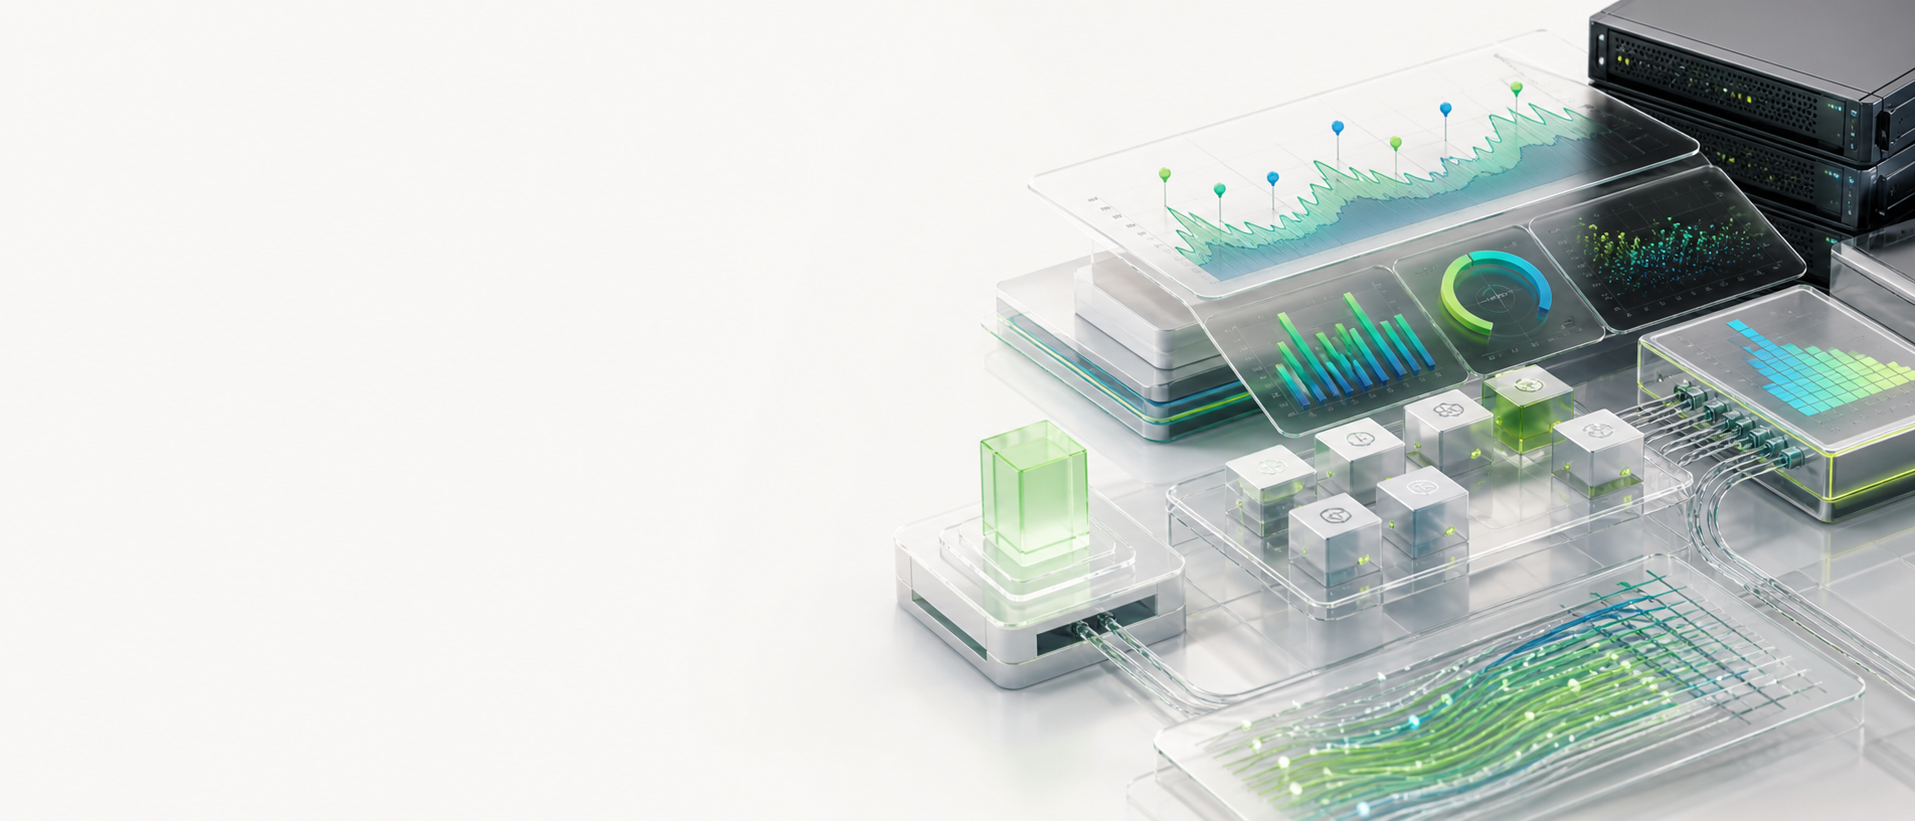
Dashboards are the saved evidence views teams return to during operations, reviews, and release decisions. CloudGrid composes them from typed widgets that keep project-scoped queries, live feeds, alerts, and evaluation evidence explicit.
Dashboards turn repeated decisions into shared views.
Executives, platform teams, and product teams ask many of the same questions every week: is the service healthy, are alerts under control, did a release change behavior, and is the AI workflow improving? CloudGrid keeps those views connected to the underlying evidence instead of storing screenshots or opaque dashboard JSON.
What CloudGrid provides
- Compose dashboards from typed widgets — metric, log, trace, live feed.
- Pin dashboards to the project sidebar for instant access.
- Each widget binds to a project-scoped query — isolation enforced server-side.
- Live-feed widgets use GraphQL subscriptions with the same auth as queries.
- Share evaluation summaries as project evidence while keeping release decisions explicit.
- Dashboards are versioned records in the control plane rather than opaque JSON blobs.
Operating model
- Free-form ad-hoc exploration lives in /metrics, /traces, and /logs; dashboards are the saved composition surface.
- Project-scoped dashboards are the current boundary.
- Dashboard sharing across companies / external links is a planned capability.
- Notebook-style analysis and scripted analytics widgets are future product surfaces.