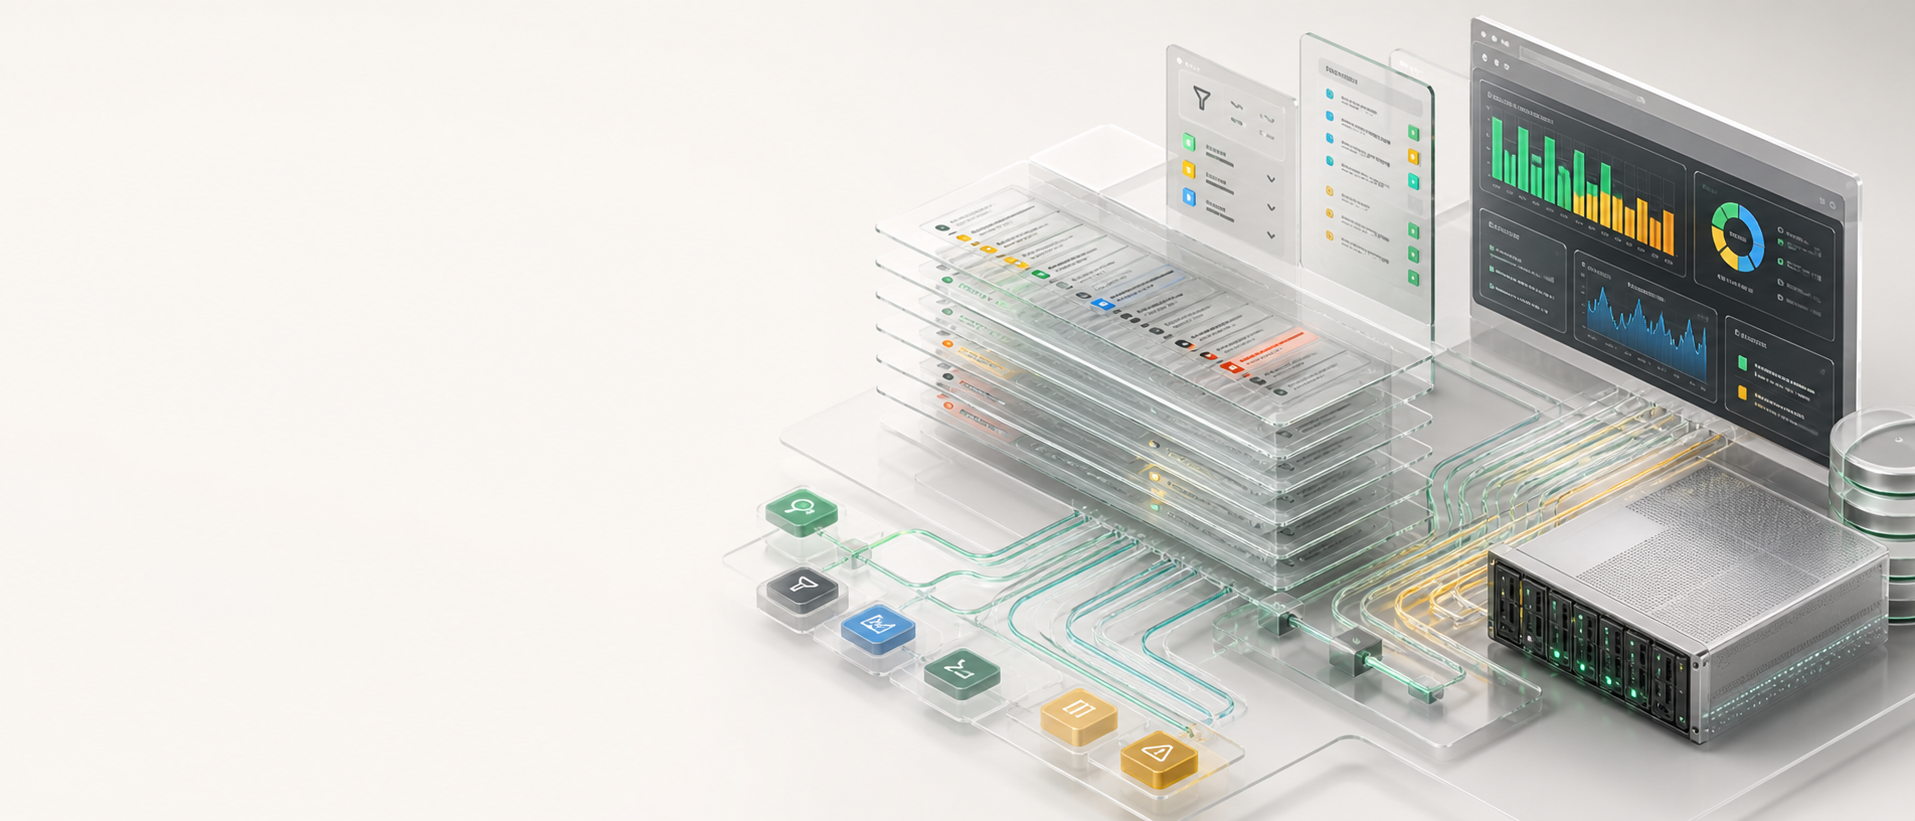
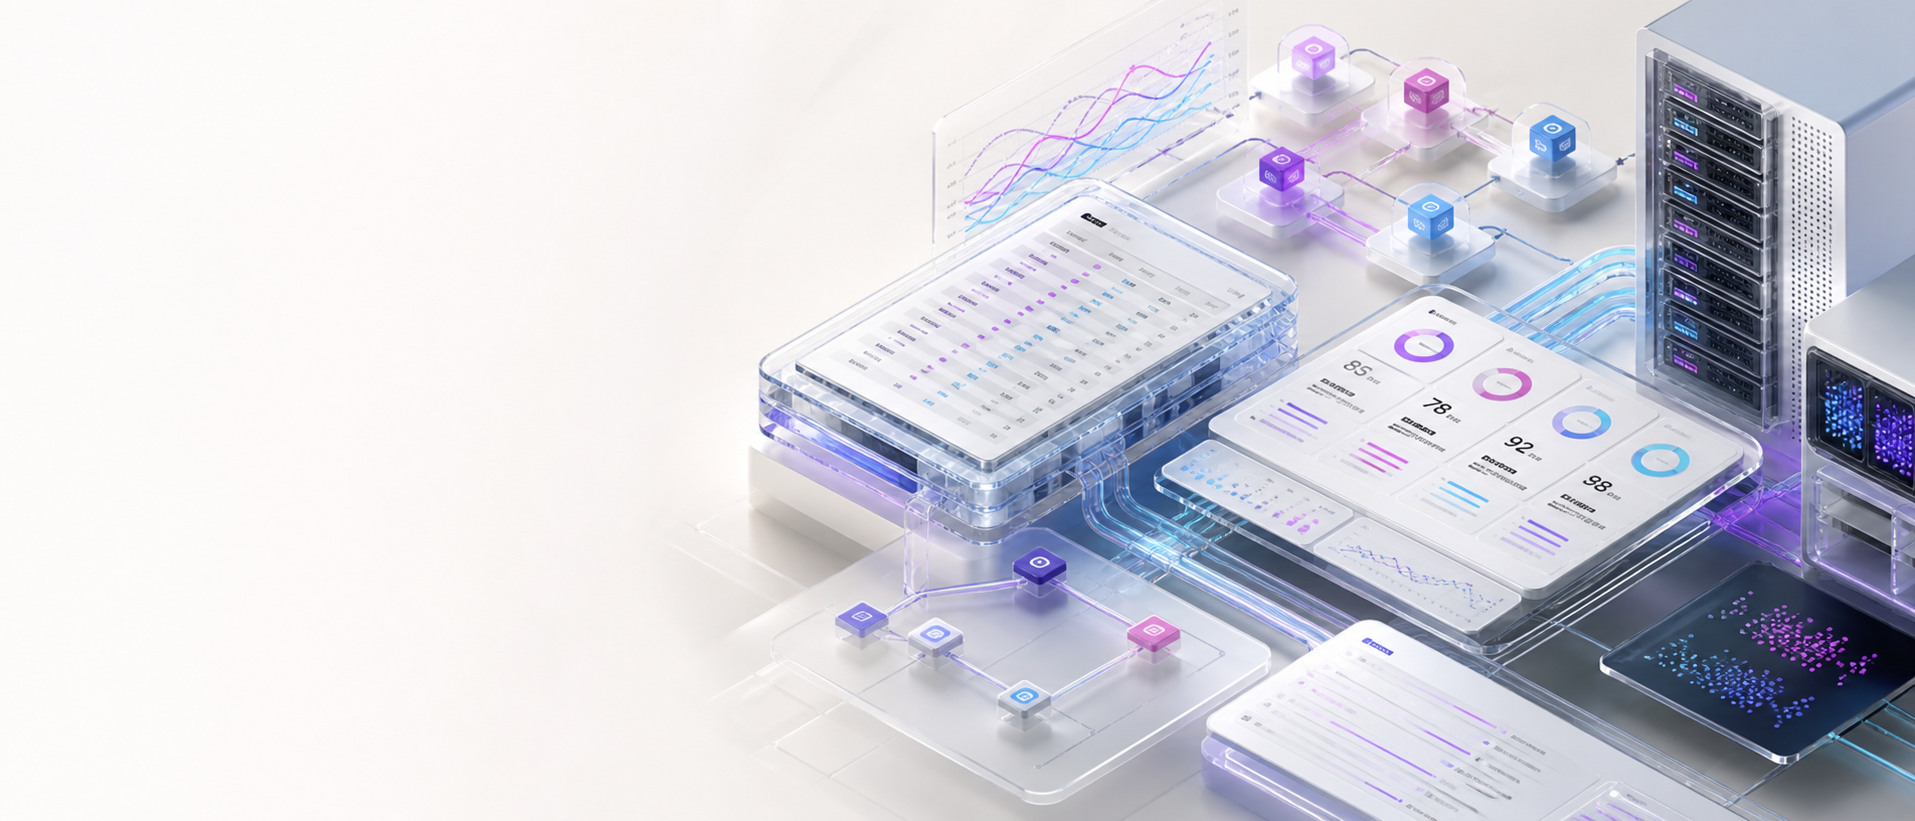
Start every investigation from the request path.
When a customer workflow slows down, fails, or produces a surprising AI result, the trace is the fastest way to see what actually happened. CloudGrid preserves OTLP spans, attributes, events, and context so other signals can point back to the execution that explains them.

Traces become the spine of operational evidence.
For a CEO or CTO, the value is not a waterfall chart by itself. The value is that teams can explain a customer-visible problem, connect it to a service boundary, and keep the evidence available for incident review, alert tuning, dashboard views, and AI evaluation.
The path from symptom to decision.
CloudGrid keeps the investigation flow direct: start with what users experienced, inspect the path that produced it, and connect the evidence to the next operational action.
A slow checkout, a failed background job, or a surprising agent response becomes easier to explain when the team can follow the exact request path.
The waterfall shows which service, operation, status, duration, span attribute, or event changed the behavior.
Logs, metric exemplars, alert evidence, dashboard widgets, and evaluation rows can point back to the trace instead of becoming detached notes.
What CloudGrid provides
- OTLP HTTP ingest on /v1/traces with JSON and protobuf encodings.
- OTLP/gRPC ingest on :4317 for trace senders that use the gRPC path.
- Project-scoped trace list with service, operation, status, and duration filters.
- Full waterfall view with span attributes, span events, and trace-context links.
- Live trace receiving over GraphQL subscriptions, filterable by service, status, or duration.
- Trace-id pivots from any log, metric exemplar, alert evidence, or AI evaluation row.
What stays under your control
- Sampling decisions stay in your SDK or collector pipeline.
- OpenTelemetry-native trace preservation means CloudGrid stores what your instrumentation sent.
- Project membership and read authorization are enforced before trace queries and live fanout.
- Long-term cold storage belongs behind alternative storage adapters.
What this changes for teams.
The same trace can support different audiences without changing the underlying evidence.
Teams can explain what happened with a durable execution record instead of reconstructing the timeline from screenshots.
New latency, error, or dependency behavior can be traced back to a concrete operation.
When an AI workflow fails, the trace can become source material for a dataset row or evaluation review.